YouTube Channel Performance Metrics: Complete analytics guide

Have you ever wondered why some YouTube channels seem to effortlessly attract millions of views while others struggle to break past a few thousand? The secret isn't just about creating great content—it's about understanding your audience & their behavior through data. Many successful content creators leverage YouTube Analytics, and there's a clear pattern: those who master their metrics master their growth.
But here's the million-view question: If you've dipped your toes into YouTube Analytics, are you genuinely swimming in its depths or just splashing in the shallow end? Are you among the countless creators who open their analytics dashboard, feel overwhelmed by the numbers, and close it again? Or do you check your views and subscriber count but miss the crucial signals your audience sends through their viewing patterns, engagement rates, and demographic data?
Are you using YouTube Analytics to its full potential to transform your channel's growth? In this comprehensive guide, we’ll explore the core areas you should follow to track your growth on YouTube and how analytics can assist in that journey.
1. Understanding your audience
Understanding who's watching your content on YouTube is key to your success. The Audience tab in YouTube Analytics provides a window into viewer behavior and preferences, offering rich demographic data that can shape your content strategy. Here, you'll discover crucial insights about your viewers' age ranges, geographical locations, and viewing patterns.
Key metrics to watch
Geography: When you open YouTube Analytics and navigate to the Audience tab, you'll find detailed geographic data showing where your viewers are coming from. You can view this information across several layers of analysis.

Primary location data shows where most of your audience is when watching your content. You can also analyze region-wise watch time, such as total watch time per country, average view duration by location, engagement rates (likes, comments, shares) from each region, and time of day viewing patterns specific to each geographic area.

Geographic data also helps you understand your earning potential in revenue analysis, as different regions have different CPM rates. Certain countries might have higher ad engagement, and some areas might be more likely to purchase merchandise or join channel memberships.
Age Distribution: get detailed age breakdowns of your viewers. You can access this data through:
YouTube Studio>Analytics>Audience>Advance Mode>Viewer age

The platform segments viewers into different age brackets. This data helps you understand if your content resonates with your intended age group. For example, if you're creating educational content for college students but notice high engagement from professionals aged 35-44, you might adjust your content strategy to serve both audiences better.
Gender Distribution: The platform categorizes viewers by gender and shows the percentage split between male and female viewers. This information can influence your content approach, presentation style, and topics. The platform analyzes how gender impacts content performance through multiple metrics: watch time, completion rates, and engagement patterns.
YouTube Studio>Analytics>Audience>Advanced Mode>Viewer Gender
You'll discover which video styles and topics resonate with different gender groups and specific engagement behaviors like commenting, sharing, and playlist additions. This information becomes particularly valuable when cross-referenced with other metrics such as geographic location, age brackets, and traffic sources.
Ways to leverage these analytics to optimize your content
Regional Content Analysis
- Review your top 3 countries by watch time and analyze viewing patterns for each. For instance, if the US, UK, and Canada are your primary audiences, examine which types of videos perform best in each market.
- Study the average view duration by region to understand engagement levels. For instance, if viewers in the US watch your content for longer than those in Canada, investigate what aspects resonate better with the US audience.
Strategic Content Creation
- Research trending topics using YouTube Trending pages for each major region or demographic. For example, if gaming content is popular in the US, consider incorporating gaming elements relevant to that market. If your channel shows a strong skew toward one gender, analyze successful videos to identify what appeals to that demographic.
- Consider regional holidays and events in your content calendar. Plan special content for occasions like Thanksgiving in the US.
Optimization Techniques
- Use location-specific tags and translations in video titles and descriptions for better regional searchability.
- Create custom thumbnails that resonate with each region's specific cultural preferences and visual styles.
- Analyze peak viewing hours for your specific audience mix. Schedule uploads and live streams during high-activity periods. Consider time zone variations if you have a global audience. Test different posting times to maximize initial video exposure.
2. Understand viewing patterns
You can dive deep into your audience's viewing habits through YouTube's comprehensive metrics. The platform reveals crucial data about your viewer retention, including the split between new and returning viewers. By analyzing watch frequency patterns, you'll identify your core audience – from loyal subscribers who never miss an upload to casual viewers who occasionally tune in. These insights help you tailor content that resonates with your specific audience segments and drives sustained growth.

Key metrics to watch
The first 30 seconds: They reveal your video's hook effectiveness—if viewers drop off quickly here, your opening isn't compelling enough. This is crucial because YouTube uses this initial retention to gauge content quality.

Retention peaks: These peaks' pattern helps you examine the most engaging moments of your video. They appear on your audience retention graph as upward spikes or elevated plateaus. These peaks indicate moments when viewers stay to watch and often rewatch specific sections, similar to how people might rewind a movie to watch their favorite scene again.
Average view duration: It represents the typical amount of time viewers spend watching your video before clicking away. YouTube calculates this by dividing the total watch time by the number of video plays, including replays.
This metric matters enormously because YouTube's algorithm favors videos that keep viewers watching longer. YouTube interprets this as a signal that your content is valuable and engaging, making it more likely to recommend your videos to others. Let's consider what different average view durations might tell you:
- If you have a 10-minute video and your average view duration is 6 minutes (60%), this indicates highly engaging content. Similarly, a 3-minute average view duration might be excellent for a 5-minute video.
- If that same 10-minute video has an average view duration of 2 minutes (20%), this signals potential issues. Perhaps your introduction is too long, the content may not meet viewer expectations, or the pacing needs adjustment.

Ways to leverage these analytics to optimize your content
The First 30 Seconds: When you notice high drop-offs in the first 30 seconds, implement these improvements:
- Create a compelling hook in the first 5-10 seconds that previews the value viewers will get.
- Move your most engaging content or crucial information closer to the beginning.
- Test different opening styles. If you are currently starting with a long intro, try jumping straight into the content.
Audience Retention Mapping: Download your retention data and create a content map as:
For videos with over 70% average retention:
- Note the exact topics
- Identify common elements (pacing, style, length)
- Create a content calendar that emphasizes these successful elements
For videos with under 40% retention:
- Mark the exact timestamps where viewers drop off
- Review those sections for potential issues like pacing problems or unclear explanations
- Restructure future similar content to avoid these patterns
Peak viewing time optimization: Using your traffic analytics, you can optimize your view time by:
- Identifying your top 3 highest-traffic time windows
- Creating a publishing schedule that posts content 2-3 hours before these peak times
- Scheduling your community posts and comments for these same high-traffic periods
3. Understand engagement metrics
Getting views is like selling tickets, but engagement is your standing ovation. In YouTube's theater, it's not just filling seats—it's keeping viewers spellbound. Every minute watched is an encore, every comment a rose, and every share a glowing review.
Engagement metrics measure how viewers interact with your content beyond just watching it. The primary metrics include likes, comments, shares, and subscriber growth. These interactions signal to YouTube's algorithm that your content resonates with viewers and deserves broader distribution.
Key analytics to track:
Average engagement rate: Your engagement rate is calculated by dividing total engagements (likes + comments + shares + new subscribers) by total views, then multiplying by 100. The average engagement rate varies depending on niche, channel size, and content quality. However, studies show that an engagement rate between 2%-3.5% is reasonable.

Ways to leverage these analytics to optimize your content
- Strong calls-to-action: You can place your CTR at specific timestamps when viewers are more engaged.
- Develop content series: When specific topics generate high engagement, consider creating series content that builds on viewer interest. This approach often leads to sustained engagement across multiple videos.
- Community building: Use engagement data to identify opportunities for community interaction. If specific video types generate more comments, incorporate more community-focused elements in similar content to foster viewer discussion.
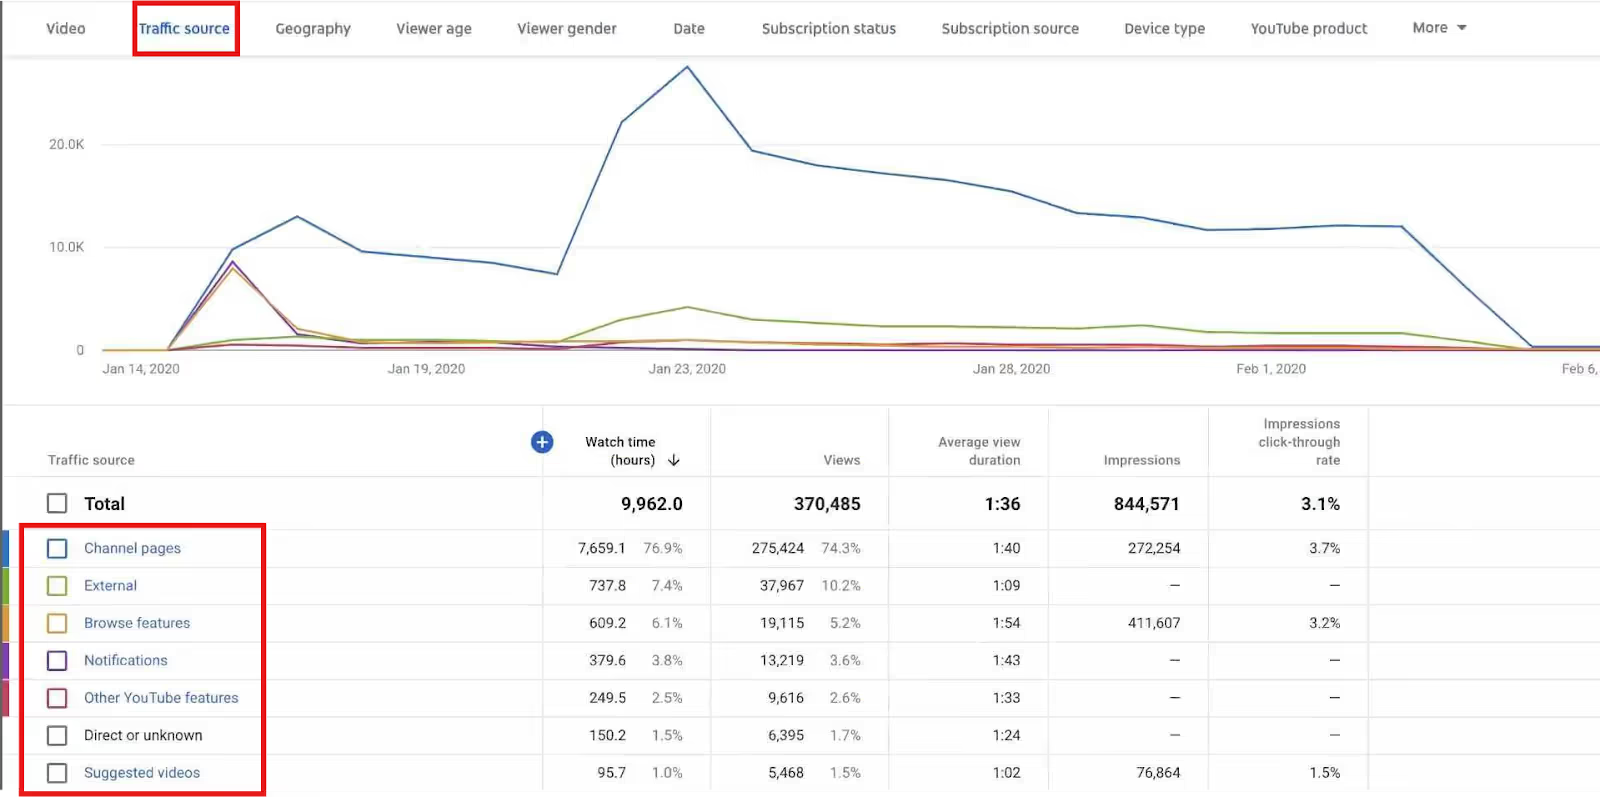
4. Traffic sources and keywords
To drive better organic growth, it’s crucial to understand where your views are coming from and what keywords are driving traffic to your videos. YouTube Analytics allows you to track traffic sources—from YouTube searches, external websites, or suggested videos. This data is essential for refining your SEO strategy and optimizing your video metadata.
Key analytics to explore:
Traffic sources analysis: See how viewers discover your content. High traffic from YouTube searches is an indication of strong SEO performance. If suggested videos drive significant traffic, it shows that your content effectively retains viewer interest. External traffic sources reveal valuable cross-platform promotion opportunities.
Search term insights: Discover top-performing search terms to understand viewer intent and language patterns. These terms reveal your audience's exact phrases when seeking content like yours. Incorporate these proven terms into your titles and descriptions, but maintain natural language that engages viewers.
Suggested videos: See which videos appear alongside yours in suggestions. This reveals your competition and potential collaboration opportunities. Videos that frequently appear together often share audience interests, helping you identify content gaps and opportunities.
Ways to leverage these metrics to optimize your content
- For traffic: To maximize your channel's reach through traffic data, start by analyzing your YouTube Analytics Search Terms report, which reveals the keywords that successfully attract viewers to your content. Access this by going to:
YouTube Studio > Analytics > Reach > Advanced Mode > Traffic Search - For search optimization, you can create videos directly addressing the most searched topics. If multiple search terms indicate similar viewer interests, consider creating comprehensive content that addresses these related queries.
Tracking these traffic sources can refine your content and SEO practices to attract new viewers, drive more traffic to your channel, and increase overall reach. (We'll cover detailed strategies in our upcoming YouTube SEO guide.) - For suggestion optimization, you can analyze the common elements between your videos and those frequently suggested alongside them. These might include topics, keywords, or presentation styles. Incorporate these elements strategically while maintaining your unique value proposition.
5. Optimizing video titles, thumbnails, and descriptions
Optimizing metadata like video titles, thumbnails, and descriptions is crucial for attracting viewers to your content. YouTube Analytics can help you understand how these factors impact click-through rates (CTR) and engagement. You can improve the performance of your future videos by analyzing which video titles and thumbnails generate more clicks.
Key analytics to examine:
Click-through rate (CTR) analysis: CTR represents the percentage of impressions that convert into actual views. For example, if your video appears in 1,000 impressions and receives 50 clicks, your CTR is 5%. YouTube considers a CTR between 2-10% healthy, with variations across niches. While analyzing your CTR, you can check:
- CTR performance over time (first 24-48 hours crucial)
- CTR comparison across different video types
- Peak CTR periods during the day

Thumbnail performance: Examining your thumbnail analytics helps identify patterns in high-performing thumbnails. Look for thumbnails achieving CTR above your channel average—typically, 4-5% is considered good. You can examine thumbnail effectiveness through these parameters:
- Click-through rate for each thumbnail style
- Average view duration from thumbnail clicks
- Audience retention correlation with thumbnail types
- Mobile vs. Desktop thumbnail performance

Title performance metrics: You can evaluate which video titles lead to higher click-through rates and watch time. This will allow you to refine your future titles. You can examine these metrics on the parameters like:
- Average title length of top performers
- Keyword positioning in successful titles
- Question vs. Statement format performance
- Search visibility correlation
Ways to leverage these metrics to optimize your content
- CTR: If specific topics or presentation styles consistently generate higher CTR, prioritize similar content in your production schedule. Consider the relationship between CTR and viewer retention—high CTR should lead to sustained viewership, not just initial clicks.
- Thumbnail Performance: Test thumbnail variations using A/B testing. Track how different design elements impact CTR across various placements and traffic sources. Pay particular attention to mobile performance, as most YouTube views come from mobile devices. Ensure your text is legible.
- Title Optimization: Develop a title optimization framework based on your analytics. Test different approaches: question-based titles versus statement formats, specific numbers versus general descriptions, and emotional appeals versus informational approaches—document which patterns perform best for various content types.
6. Video Performance by Playlist
Playlists are a great way to keep viewers on your channel for longer sessions. When added to playlists, YouTube Analytics lets you see how well your videos perform. By identifying which playlists bring in the most views and engagement, you can customize your content strategy to create more cohesive and relevant playlists for your audience.
Key analytics to review:
Playlist performance: The playlist performance report shows several key data points. First, examine the number of views originating from playlist pages versus direct video views. This indicates how effectively your playlists attract viewers. Next, analyze the average number of videos watched per playlist session. Higher numbers suggest strong playlist organization and content flow.

View duration analysis: The average view duration metric within playlists deserves particular attention. This metric shows how long viewers stay engaged when watching videos through your playlist versus finding them individually. A higher average view duration in playlist views than direct views indicates effective playlist organization.

Ways to leverage these metrics to optimize your content
- Content sequencing: Arrange videos in a logical progression that builds viewer knowledge or interest. If analytics show viewers frequently leaving after specific videos, reassess their placement in the sequence. Consider moving stronger content earlier in the playlist to boost initial engagement.
- Theme cohesion: Review playlists with higher engagement rates to identify common elements. Use these insights to strengthen underperforming playlists. For instance, if tightly themed playlists consistently outperform broader collections, consider breaking more extensive playlists into more focused segments.
- Cross-promotion strategy: Analyze which playlists encourage viewers to subscribe to your channel. Strategically place your most effective subscription-driving content within playlist sequences. This will help convert casual viewers into long-term subscribers.
By understanding playlist performance, you can create targeted playlists that increase your chances of keeping your audience engaged for longer periods, leading to more channel growth.
7. Real-time analysis
Real-time analytics provide immediate feedback on video performance within the first 48 hours of publication. This data appears in two key windows: the last 48 hours and the last 60 minutes. When examining real-time views, compare current performance against your channel's baseline metrics. For instance, if your videos typically accumulate 1,000 views in the first hour, a video reaching 2,000 views signals stronger-than-average performance.
Key metrics to explore:
Real-time views: this graph reveals crucial patterns in initial viewer engagement. Pay particular attention to spikes in viewership, as these often correlate with external sharing or algorithm promotion. If you notice a sudden increase in views, examine the traffic sources report to identify what triggered the surge. This information helps replicate successful promotion strategies.

Trending topics: this section shows how your content aligns with current viewer interests. YouTube provides data on search queries and topics gaining momentum. When your video relates to trending topics, monitor how view velocity compares to your standard performance. Higher-than-average view velocity often indicates strong topic alignment.

Ways to leverage these metrics to optimize your content
- Timing refinement: Use real-time data to identify optimal publishing windows. Adjust your publishing schedule accordingly if analytics consistently show stronger initial performance during specific times. Monitor how different publishing times affect first-hour view counts.
- Content adjustment strategy: When real-time metrics indicate underperformance, consider immediate optimizations—this might include updating titles, descriptions, or thumbnails to capture viewer interest more effectively. Track how these changes impact view velocity in the subsequent hours.
- Trend capitalization: Monitor real-time performance alongside data on trending topics. When you identify content that aligns with current trends, consider creating follow-up videos while viewer interest remains high. Use real-time metrics to gauge whether trend-related content maintains engagement.
8. Comparing performance across multiple videos
Comparing the performance of multiple videos over time can help you identify trends in what works best for your channel. This can help you pinpoint the videos that resonate most with your audience, allowing you to focus on content that drives higher engagement and growth.
Key YouTube Analytics to track:
Video comparison: When examining the video comparison dashboard in YouTube Analytics, focus on analyzing multiple performance indicators simultaneously. The platform allows you to compare up to 24 videos across various metrics, including views, watch time, and engagement rates. This comparative analysis reveals patterns in content performance that might not be apparent when examining videos individually.

Top videos: Analyze your top-performing videos by examining multiple success indicators. Consider not just view counts but also metrics like viewer retention, subscription rates, and long-term performance. This comprehensive analysis often reveals that your most successful videos share common elements in their structure, presentation style, or topic selection.

Ways to leverage these metrics to optimize your content
- Content format refinement: When identifying high-performing content types, develop a framework for replicating their success. Document specific elements that contribute to stronger performance, such as video length, pacing, or presentation style.
- Topic selection enhancement: Use comparison data to inform your content planning. If specific topics consistently outperform others, consider developing more content in those areas while maintaining quality and avoiding saturation.
- Production quality alignment: Compare production elements across your video portfolio. When you notice that specific production techniques correlate with better performance, incorporate these elements into your standard production process.
9. Competitor analysis
Staying ahead of the competition is key to thriving on YouTube. While YouTube Analytics doesn’t give you a direct peek into your competitors' data, it provides powerful insights that let you measure your performance against others in your niche.
Key YouTube Analytics to track:
Industry trends: YouTube Analytics provides valuable insights into how your content performs relative to industry benchmarks. When examining industry trends, compare your performance metrics against similar channels in your niche. The trends dashboard reveals which content types and topics are gaining traction within your industry. By monitoring these trends, you can identify emerging opportunities before they become saturated.
For instance, if you notice a surge in viewer interest around specific topics, you can develop content that addresses these areas while maintaining your unique perspective.

Growth pattern evaluation: Growth pattern analysis examines the relationship between content publishing frequency and audience development. When analyzing growth patterns, pay particular attention to how your content velocity compares to successful channels in your niche. If competitors posting three times weekly show stronger growth than those posting daily, this suggests that quality might be more important than quantity in your niche.
Ways to leverage these metrics to optimize your content
To leverage these insights effectively, develop a systematic approach to content optimization:
Content calendar alignment: Adjust your publishing schedule based on observed industry patterns. If analytics show higher engagement during specific periods, align your most crucial content releases with these optimal windows.
Topic selection refinement: Use industry trend data to inform your content planning. By identifying emerging topics early, you can develop comprehensive content that establishes your authority before the market becomes crowded.
Competitive differentiation: While monitoring industry trends, look for underserved areas within popular topics. This allows you to create unique content that stands out while still benefiting from trending interest.
By staying informed about what’s working in your niche and comparing it with your data, you can anticipate trends and refine your strategies to outperform your competitors.
Looking ahead
Transform your YouTube journey from guesswork to guaranteed growth with the power of analytics. Every view, click, and comment tells a story – one that can unlock unprecedented success for your channel. By diving deep into your audience demographics, tracking video performance patterns, and fine-tuning your SEO strategy, you'll find the secret sauce that sets viral content apart from the rest. So, take control of your channel's destiny today by mastering YouTube Analytics – your dashboard for data-driven decisions and explosive growth. The time to elevate your content game is now. Start analyzing, start optimizing, and watch your subscriber count soar!
FAQs
How do machine learning algorithms process multi-dimensional viewer behavior patterns in YouTube Analytics?
Contemporary ML systems analyze viewer behavior through nested neural networks, processing over 1000 micro-interactions per viewing session. The algorithm evaluates behavioral clusters, including cursor movement patterns, playback speed adjustments, and frame-by-frame engagement metrics to construct comprehensive viewer interaction models.
What role do temporal-spatial viewing patterns play in YouTube's algorithmic content distribution?
Research indicates that YouTube's content distribution algorithm incorporates complex temporal-spatial matrices analyzing viewing patterns across different time zones and geographical regions. Studies show that content performance metrics are weighted differently based on temporal relevance and regional viewing behaviors.
How do YouTube's predictive analytics models calculate potential video performance?
Advanced predictive modeling utilizes historical performance data combined with real-time viewer behavior analysis. The system employs Bayesian probability frameworks to forecast potential video performance within the first 30 minutes of publication, considering over 100 distinct performance indicators.
What impact do device-specific engagement patterns have on analytics interpretation?
Device-specific analytics reveal distinct viewing behaviors across platforms. Research shows that mobile viewers demonstrate 15-20% shorter average view durations but 40% higher engagement rates in interactive features compared to desktop users, necessitating platform-specific optimization strategies.
How do YouTube's A/B testing algorithms evaluate thumbnail effectiveness?
YouTube employs sophisticated multivariate testing frameworks for thumbnail analysis. The system simultaneously tests multiple variables, including color psychology impact, facial recognition patterns, and text placement optimization, utilizing neural network analysis to determine optimal combinations.
What role do audio engagement metrics play in overall video performance analysis?
Recent studies indicate that YouTube tracks specific audio engagement metrics including volume adjustments, caption activation patterns, and audio-visual synchronization impact on retention. These metrics contribute to a comprehensive "audio engagement score" affecting content distribution.
How does YouTube's algorithm process cross-language content performance?
The platform employs advanced natural language processing to analyze content performance across linguistic boundaries. The system evaluates translation effectiveness, cultural relevance markers, and cross-cultural engagement patterns to optimize global content distribution.
What impact do seasonal viewing patterns have on historical performance metrics?
YouTube's analytics system incorporates complex seasonal adjustment factors in performance evaluation. The algorithm applies weighted coefficients to normalize performance metrics across different seasonal periods, accounting for cyclic viewing pattern variations.
How do collaborative filtering algorithms influence content recommendation analytics?
YouTube's collaborative filtering systems employ matrix factorization techniques to analyze viewer preference patterns. The algorithm processes viewing history correlations across millions of users to generate content affinity scores, impacting recommended video performance metrics.
What role do psychological engagement markers play in retention analytics?
Recent research reveals that YouTube tracks subtle psychological engagement indicators, including micro-expressions in viewer comments, emotional sentiment patterns, and behavioral response clusters to evaluate content's psychological impact on viewer retention.